
As the 2016 fight for free education enters its fourth week, let’s take a look back at what the data has to say about the protests on Twitter. Let’s start off by reminding ourselves of the main communities involved (see my earlier post here summarising the initial communities forming). As I stated in that post, the protests are far more regionally distinct than they were at this time last year (see my article on the 2015 protests here), perhaps pointing towards a more organised movement this time around; or perhaps due to the fact that the protests never really went away and the communities have been building around specific regional focal points for several months now.
I’m looking at 501,328 #FeesMustFall-related tweets covering the 19th Sept until the 7th October 2016 in this post. Here’s what the conversation map for that data looks like, where each node represents a Twitter user, and we connect users when they interact with each other either by @mentioning or retweeting each other (I’ve blurred out the names of some individuals’ accounts for privacy reasons:
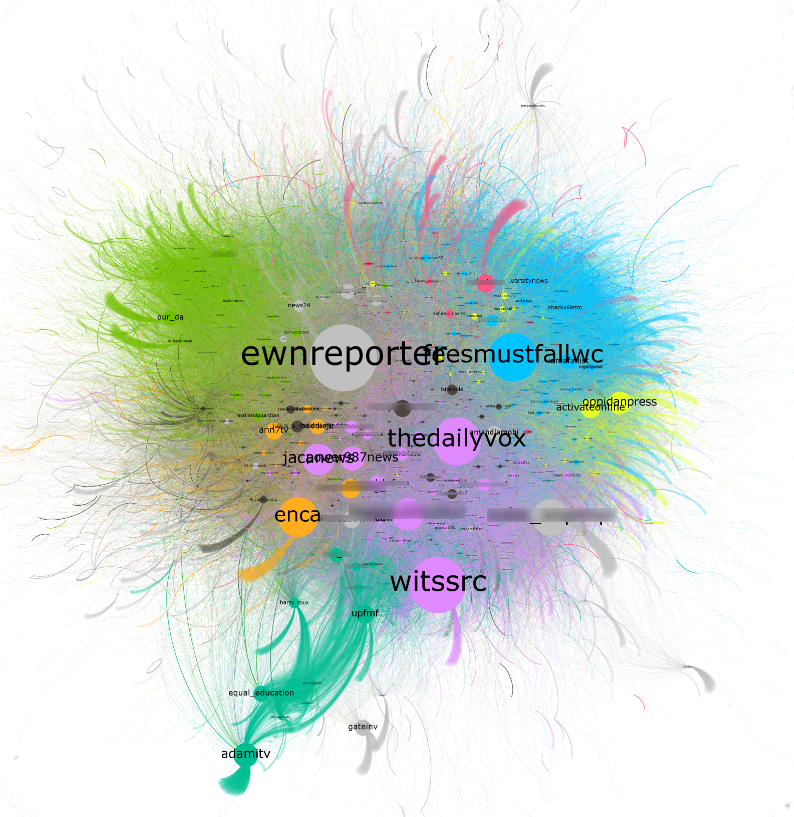
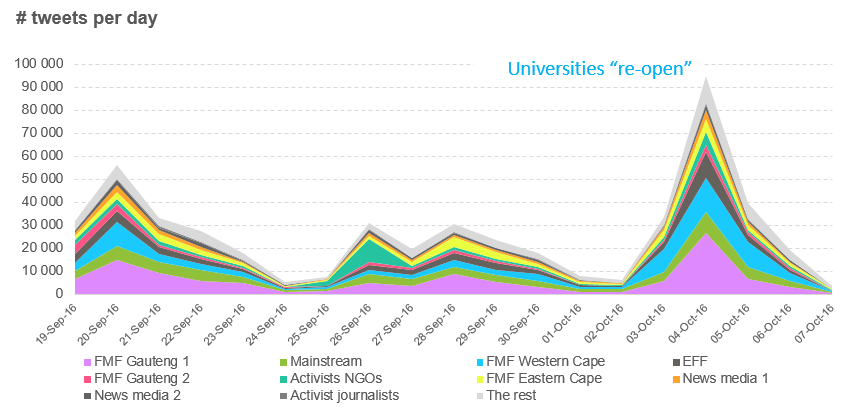
When we further breakdown the communities based on how many Twitter users fall into each and the proportion of tweets that each generated, the regional structure becomes even clearer, with distinct communities based in the Western Cape (UCT and Stellies), Eastern Cape (Rhodes/UCKAR and NMMU) and Gauteng (especially Wits, UP and TUT). The chart below also shows that activists coming out of Wits (the pink ‘FMF Gauteng 1’ community) and UCT (the blue ‘FMF Western Cape’ community) have definitely been the most vocal, producing a larger proportion of tweets than we would have expected given how many members they have (although they both have many members). Note that the colours of the bubbles match the colours on the conversation map above.

The DA, ANC and many other celebrities and commentators all fall into the green “Mainstream” community, while the EFF has managed to create its own community of commentators that sits at the intersection of the Mainstream and the largest FeesMustFall activist community. In other words, the EFF appears to be placed true to its positioning as a more radical, revolutionary party by straddling the mainstream while still tapping into student anger and frustration.
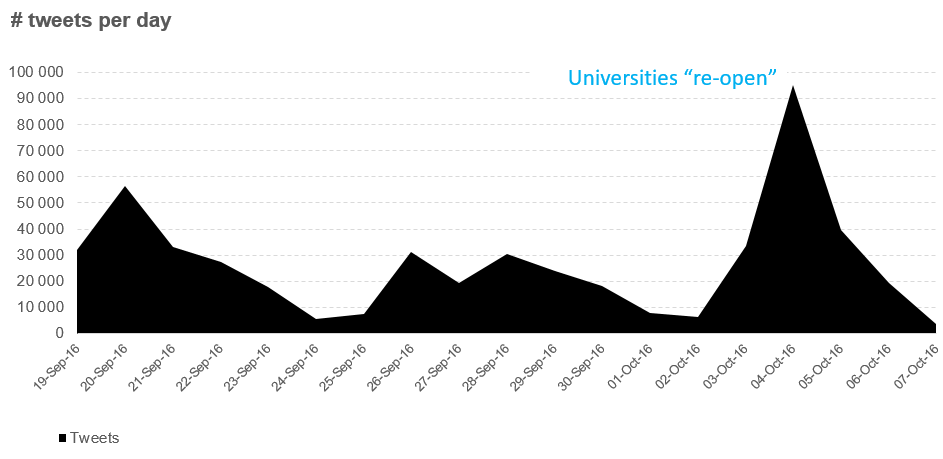
The volumes have been consistently high throughout the time period. Only the State of the Nation Address (SONA) has generated higher volumes this year. SONA generated nearly 430,000 tweets in 24 hours (see some research on that here) – almost as much as our entire #FeesMustFall 2016 dataset so far. As you can see on the chart below, far from things dying down, volumes actually peaked on the 3rd of October when universities were supposed to re-open and activists doubled down on their attempts to keep universities closed. While it falls outside of this current dataset, it remains to be seen whether the student protests that turned violent on the streets of Braamfontein at the beginning of this week (8 & 9 September 2016) caused an even greater spike. We’ll have to delve into that in another post.
My analysis of last year’s protests (linked above) clearly showed that they were initially spurred on by activists at Wits acting mostly in isolation. Those activists managed to keep the discussions alive for about a week before UCT-based protesters stormed parliament. It was this event, the storming of parliament, that exploded the protests onto the national stage. After that event, other universities joined the fray one by one. We don’t see that kind of pattern of piece-meal solidarity formation here. Instead, we see that all communities have been consistently active since the start of the dataset. This is unsurprising in hindsight as student activists have had months to form networks and plan their strategy. This does again speak to the more organised nature of protests this time around.
So we’ve looked at the main groups involved and we have seen that they are much more strongly regional than last year. We also see that protests have hit the ground running as they appear to have tapped into existing networks that have formed over the period since the original 2015 protests. We’ve also seen that the volume of discussion around the protests have been increasing as events have turned more violent and chaotic. Let’s finish off by taking a look at the top content that has really resonated with Twitter users in the context of the protests over the past few weeks.
The themes that dominate the top tweets pretty much sum up the main themes of the protests, including highlighting the absurdity of the current economics of education, heavy-handed policing, and the battle for young, black South Africans to assert themselves in what they still believe to be a white-controlled country:
Do you support the right of students to protest peacefully to ensure #FreeEducation for the #Poor?#FeesMustFall
— Social Justice #SJM (@Adamitv) October 4, 2016
You went to high school for free because you couldn't afford R500 for fees but you're expected to pay R50k at varsity, HOW? #Fees2017
— SEFULARO KEAMOGETSWE (@Sefularo_Keamo) September 19, 2016
Police surround peaceful students. Most move away. Throw stun grenade and sergeant shouts to arrest them students #FeesMustFall #wits pic.twitter.com/XqsclVRWfi
— Jameel (@indie_impimpi) October 4, 2016
The #ANC @MYANC has betrayed the poor and principles of the #FreedomCharter e.g.#FeesMustFall #Poverty #Inequality
— Social Justice #SJM (@Adamitv) October 3, 2016
Do you agree?
@Radio702 @gwalax fact check before you say students burned the bus. Here you see criminals stealing the parts. Don't incite!!#FeesMustFall pic.twitter.com/0CSCWewaH0
— Jabulani (@jabuchenpereira) October 10, 2016
Zuma gets a private get worth 4 billion , a hunger strike for #Freeeducation #FeesMustFall is needed ...
— Skattie (@Mmalenyalo_) September 14, 2016
"The decolonized national anthem." || #Wits #Fees2017 #FeesMustFall pic.twitter.com/86lClvftRd
— Lindokuhle Xulu (@LindokuhlXulu1) October 7, 2016
#FeesMustFall What a shot! (Marco Longari/AFP) pic.twitter.com/H5ijr0DICX
— Nomsa Maseko (@nomsa_maseko) October 4, 2016
[Banner image source]
Ok, I know this is an odd comment, but what analytics tools did you use for your analysis of Twitter conversation data?
Hey Brett. They are custom-made tools.