

South Africa is one of the most unequal countries in the world. Our Gini co-efficient, which summarises the disparity between those with the least and most income, is one of the highest in the world (only Lesotho’s is higher according to the CIA Factbook).
We can blame this inequality on the systemic structures that we have introduced over the lifetime of our country, starting informally in the early days of colonisation and getting more formalised through efforts to remove the franchise for specific races through the 1800s and early 1900s, as well as economic policies introduced by captains of industry such as Cecil John Rhodes in the late 1800s to ensure the steady supply of cheap labour for their mines. And, let’s not even get started on what the Apartheid era did to firmly entrench these policies. The net result of all these structures introduced over centuries was a system that allowed white South Africans to rise easily to the top of the economic ladder at the expense of other races.
The net result of all these structures introduced over centuries was a system that allowed white South Africans easily to rise to the top of the economic ladder at the expense of other races.
One of the biggest challenges facing post-1994 governments has been to dismantle a system stacked in favour of one race group and make it more equitable. So, how are we succeeding at this? Well, without looking at any data, I’m sure it’s safe to say that we are faring dismally in this area if our current social milieu of daily protests is anything to go by (I write this as students block off access to universities and face up to the police – a repeat of last year’s #FeesMustFall movement).
Having said that, the data does show that we are moving in the right direction, even if we’re not doing it fast enough.
Let’s agree to an interpretation of this data that assumes that, in an ideal South Africa, we would want everyone to have access to the same high standard of living that white South Africans disproportionately enjoy currently. By that logic then, the goal is to raise up as many South Africans as possible to a higher standard of living which means that we should be less focused on how many white South Africans already enjoy the lifestyles that we all want. Instead, we should be focused on how many more South Africans are attaining a similar level of economic self-determination.
…we should be less focused on how many white South Africans already enjoy the lifestyles that we all want. Instead, we should be focused on how many more South Africans are attaining a similar level of economic self-determination.
This post was prompted by a BusinessTech article that appeared in my Facebook feed. It summarises research undertaken by the Institute of Race Relations on household expenditure. As BusinessTech puts it, “The data is contained in a research report from the IRR in 2015, showing consumer expenditure trends among South Africans, broken down by expenditure level and race.”
BusinessTech uses the research data on household expenditure as a proxy for evaluating household wealth by race. They quote percentages in a way that exaggerates the disparity between groups. For example, they say that:
“The breakdown reveals massive levels of inequality, where almost two-thirds (61%) of white households fall into the highest level of monthly expenditure (R10,000+), compared to only 8% of black households, and 20% of coloured and 43% of Asian/Indian households.
Conversely, the majority of black African households (60%) are spending under R2,500 a month, compared to just 6% of white households, 32% of coloured households and 10% of Asian/Indian households.”
This, to me, is where the real story lies: black South Africans have edged out white South Africans in the top household expenditure bracket.
I don’t think that this is the right way to look at the data for reasons that I explain below. First though, the below chart is my attempt to re-contextualize the data in a way that makes more sense (at least to me). For starters, you will see that black South Africans make up the vast majority of all expenditure brackets. It’s only in the top expenditure bracket that white South Africans give them a run for their money (no pun intended). This, to me, is where the real story lies: black South Africans have edged out white South Africans in the top household expenditure bracket. To the extent that we really can use household expenditure as a proxy for wealth, this tells a very different story about economic transformation than the one summarised above.
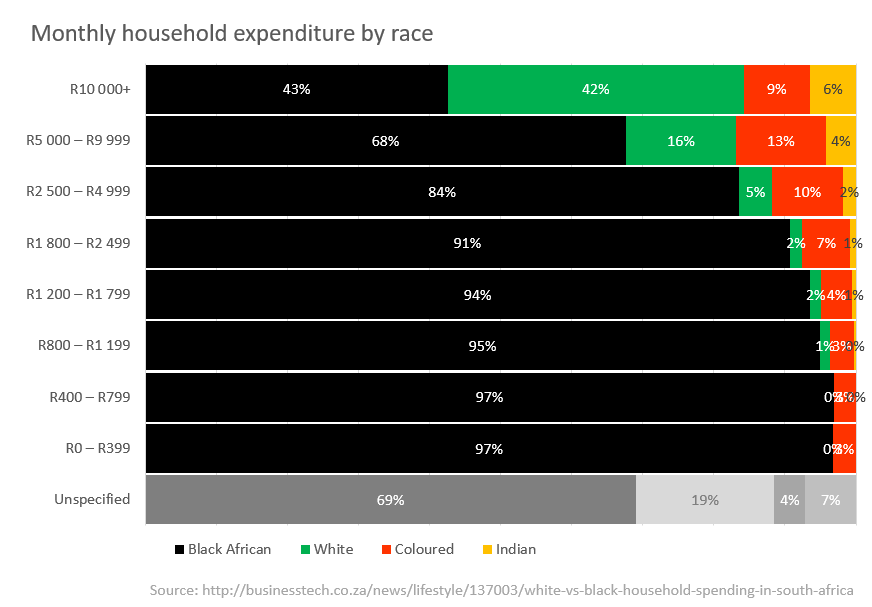 [EDIT: I changed the way I visualised this chart to emphasise the size of the black population – 81%]
This data is a great example of the subjectivity of statistics – they can be read in a variety of ways. The BusinessTech article focuses on the fact that only 8% of black households are in the highest expenditure group while 61% of white South Africans fall into this group. The problem with this narrative is that we are comparing wildly different-sized groups. White South Africans represent about 8% of the population while black South Africans represent 81% (according to StatsSA’s mid-2015 estimates).

It is unrealistic to assume that everyone in society should have exactly the same amount of income and wealth (various socialist utopias tried this; it didn’t work). Some wealth inequality in a society is fair. The problem comes in when the extremely wealthy race away from the extremely poor, creating inequality on a level that destabilises society (which is the situation that South Africa finds itself in, and the way in which a country manages its level of inequality through policy is a separate discussion that we desperately need to have).
Given that there will always be some with more wealth than others, this means that not everyone can find their way to the top of the economic ladder, where space is necessarily limited. In the South African context, white South Africans have had a free pass into this bracket and so we represent a larger proportion within it than we would have in a society that had been not stacked in our favour for so long. The fallacy in the narrative referred to above though is that it is not possible to fit 81% of the population into the top household spending bracket. At a rough estimate, it looks like only about 15% of the overall population can fit into the bracket currently, which means that the vast majority black South Africans will always fall outside of it.
[UPDATE: This figure visualises the maximum proportion of the South African population that currently can fit into the top household expenditure bracket:]

Recognizing this fallacy changes the narrative. Instead of quoting the overall proportion of each race present in each wealth bracket, we should be quoting what proportion of each wealth bracket is made up by each race. It’s a subtle but important difference for our national narrative.
Instead of quoting the overall proportion of each race present in each wealth bracket, we should be quoting what proportion of each wealth bracket is made up by each race.
This leads to a more optimistic narrative: according to my original chart above, black South Africans have overtaken white South Africans as the group with the largest household expenditure. To the extent that this is a proxy for wealth, we can say that the black middle and upper classes has pulled ahead of their white countrymen. This is a far more encouraging narrative of modern South Africa I think. The below chart (again, from the BusinessTech article) is based on data from the Unilever Institute at the University of Cape Town and it reflects the growth in the black middle class:

The BusinssTech article goes on to describe the data on South Africa’s black middle class as follows:
“…in terms of South Africa’s rising black middle class, updated figures showed that this segment has more than trebled over the past 12 years, while the country’s white middle class has shrunk over the same period.
City Press reported that the black middle class is up to 5.81 million, citing University of Cape Town marketing professor, John Simpson.”
Obviously, there are many caveats to this interpretation of the data though that continue to make a direct comparison problematic:
First and foremost is that the transformation is not happening fast enough. If it were happening at the right pace, we wouldn’t have the social upheaval that we currently face. But, it is happening and we should recognise that too.
…transformation is not happening fast enough. If it were happening at the right pace, we wouldn’t have the social upheaval that we currently face. But, it is happening and we should recognise that too.
In addition, these stats don’t take into account that R10,000 per month is not a very high threshold. There is still much room above this amount for variation in household wealth between race groups that might not have been captured here.
We also don’t get any insight into how the various households are funded but, from what I’ve read and seen (anecdotal, I know), black households are more likely to to be subject to predatory lending practices and thus debt might make up a larger proportion of their spend than other households (although it’s difficult to make such sweeping generalisations about a group that makes up 81% of our population).
Similarly, the size of households varies by race. From the BusinessTech article, black households contain an average of 7 members compared to 5 for other race groups:
“According to the Pietermaritzburg Agency for Community Social Action (Pacsa), the average household in South Africa comprises 5 family members (a mix of children, adults and the elderly), shooting up to 7 members in black households.”
This disparity also relates to the “black tax” (further reading: Mail & Guardian | City Press | eNCA | Radio702) that many black households need to take into consideration when providing for their members and which diminishes their like-for-like spending power.
So, what’s the point of this article? Well, I might be accused of indulging in whitesplaining or white guilt in writing up this article and using data to support my subjective narrative. I understand that possible interpretation because South Africa is still a deeply unequal society and we need to be sensitive about not sweeping our real issues under the carpet. There are two things that I hope you take from this though:
Firstly, it’s deeply problematic to compare a group making up 81% of the population to others making up less than 10% since the 81% group will necessarily be represented everywhere and can thus be used to support a variety of conflicting narratives.
…it’s deeply problematic to compare a group making up 81% of the population to others making up less than 10% since the 81% group will necessarily be represented everywhere
Secondly, I hope that I have impressed upon you that something IS happening in regard to transformation in our country; it’s just not happening fast enough. Despite that, we should still recognise the changes happening rather than use statistics to highlight a narrative that exaggerates the racial disparities because we don’t need those flames fanned any further right now. Instead, we need to recognise what is working and show solidarity in tackling these issues further.